Product cost (VA, NVA) vs. Investment CAPEX
Example Breakdown: Detailed Production Time Analysis
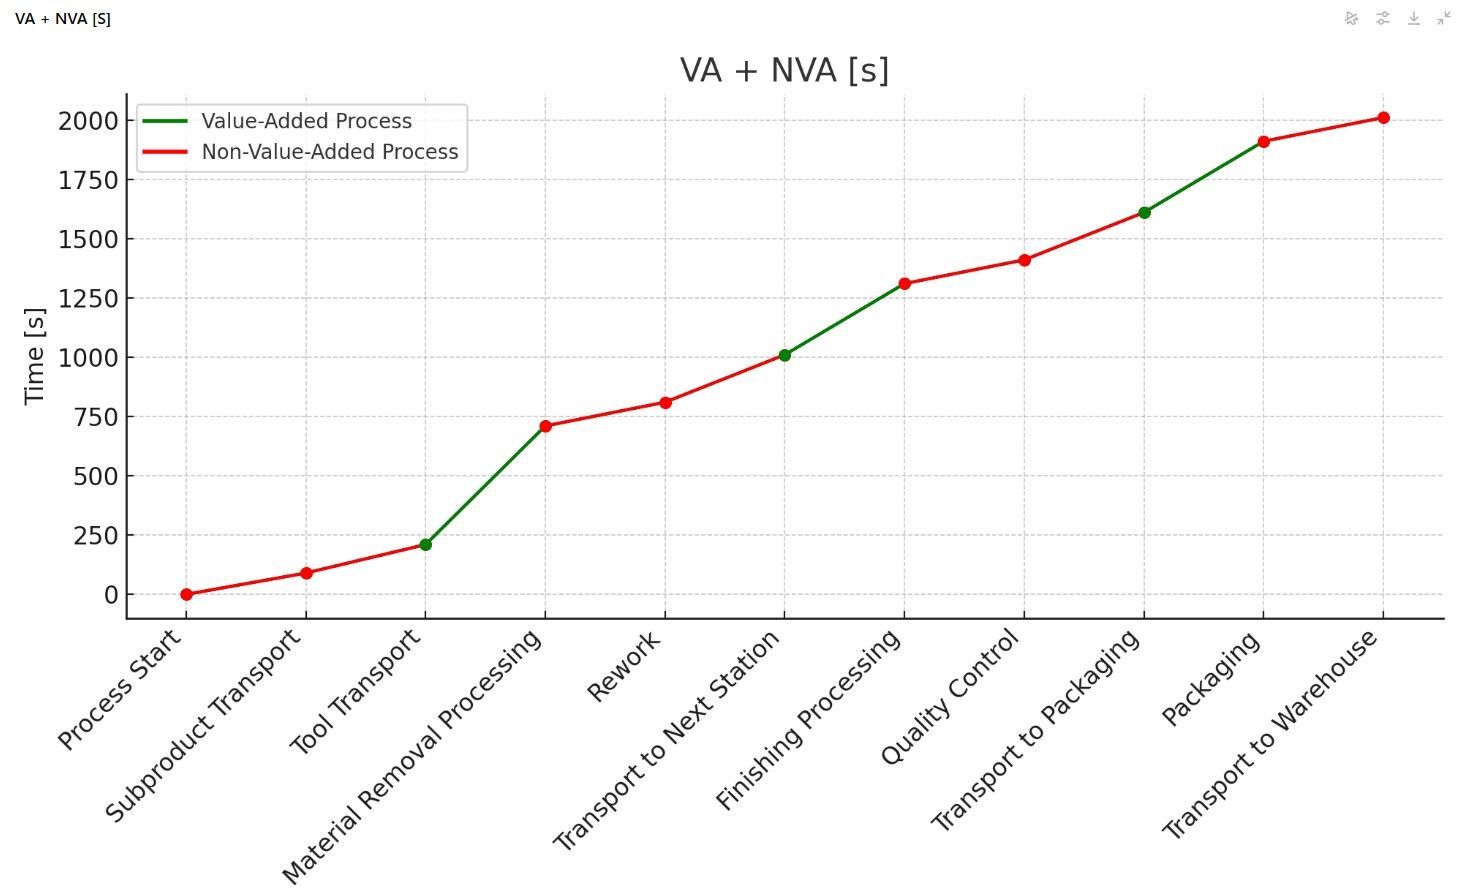
For the above example, the total production time is 2010 seconds, broken down as follows:
- Value-Added (VA) Time: 1200 seconds (59.70%)
- Non-Value-Added (NVA) Time: 810 seconds (40.30%)
Returning to the main discussion, if only the overall production time is used in product calculations—without a detailed breakdown—it becomes extremely difficult to estimate potential savings in areas such as transportation or quality control.
Therefore, it is crucial at the initial stage to establish the correct measurement method and determine the appropriate size of the reference sample.
CAPEX – Calculating Potential Investment Based on NVA
CAPEX, or Capital Expenditure, refers to the investment outlay for purchasing assets. Often, mid-level and senior managers must forecast investments using only limited data, especially toward the end of the fiscal year.
While this isn’t the only or most precise method, it’s one of the simplest and fastest ways to get a rough estimate. One effective approach to planning ROI is to target the largest component of Non-Value-Added (NVA) activities—in this case, internal transportation. For our example, internal transportation takes 710 seconds, which is 35.23% of the total production time. With this insight, you can quickly gauge the potential budget for future investments.
Example Calculation:
- Daily Production Employees: 100
- Average Monthly Salary: 6,580 PLN
- Monthly Employee Cost: 658,000 PLN
- Annual Employee Cost: 7,896,000 PLN
Based on our breakdown:
- Value-Added (VA) Costs (59.70%): 4,713,912.00 PLN
- Non-Value-Added (NVA) Costs (40.30%): 3,182,088.00 PLN
Considering that some companies view a 2-year ROI as attractive, this example suggests a CAPEX of approximately 6 million PLN for close-range transportation equipment. It’s important to note that internal transportation can’t be entirely eliminated—someone must load and unload products or semi-products on the line. However, if NVA could be reduced to 10%, the potential CAPEX would be around 2,386,560.00 PLN for a one-year payback period, or 4,773,132.00 PLN for a two-year payback period.
Calculating potential CAPEX in this way is invaluable for budgeting investments and assessing production potential. In upcoming posts, we’ll explore in greater detail how changeovers impact NVA and the planning implications they bring.
Thank you for your time, and please feel free to get in touch with any questions or comments.